Thylacine brains from Museum collections


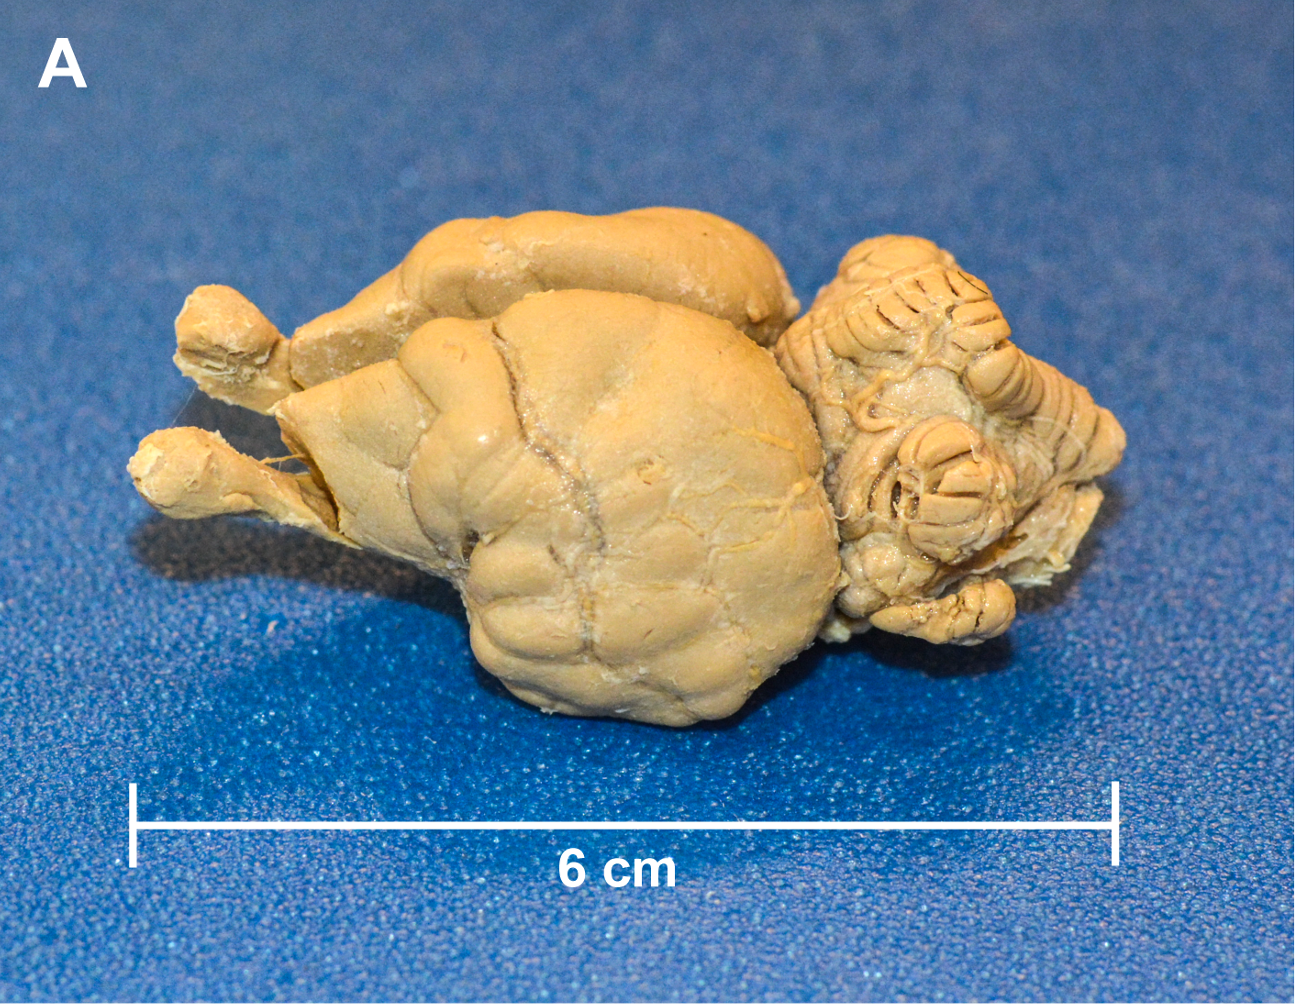
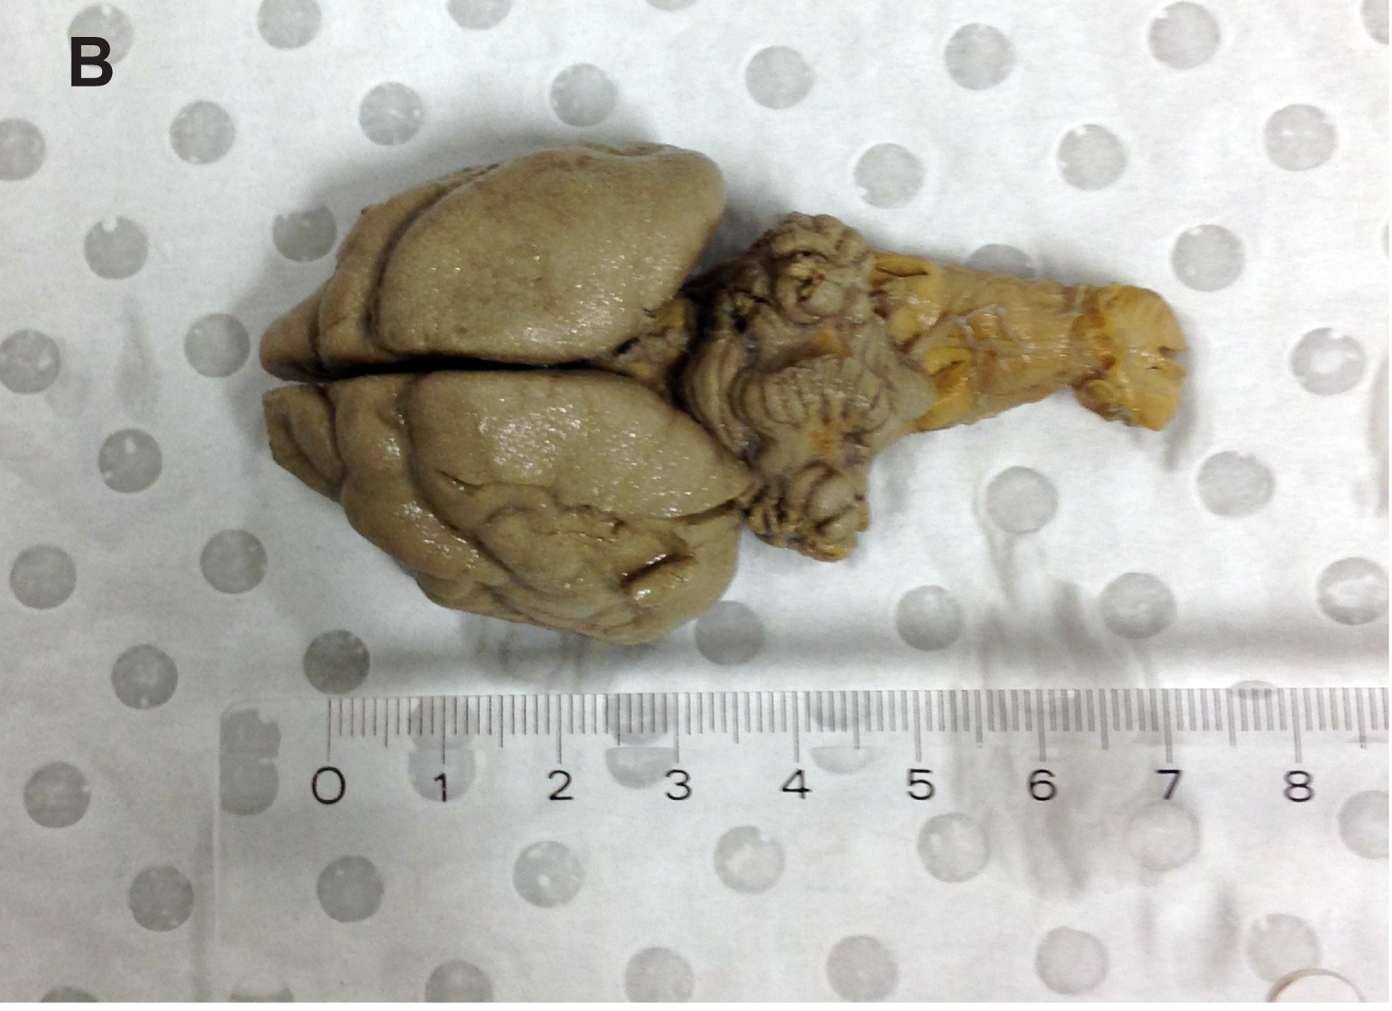
These images above are from Bern and Ashwell, (2017). Figure A) Thylacine 1 (courtesy Smithsonian, USNM 125345); Figure B) Thylacine 2 (courtesy Australian Museum, M18411)
Reference: Berns GS, Ashwell KWS (2017) Reconstruction of the cortical maps of the Tasmanian tiger and comparison to the Tasmanian devil. PLoS ONE 12(1): e0168993. https://doi.org/10.1371/journal.pone.0168993 https://journals.plos.org/plosone/article?id=10.1371/journal.pone.0168993
Cortical maps of basal ganglia projections in four specimens (Tasmanian tiger and Tasmanian devil)
Bern and Ashwell (2017) used a thylacine brain from the Australian Museum that was more than 100 years old. The authors show that it is possible to reconstruct white matter tracts in two thylacine brains (Thylacine 1 and 2). They compare this with the white matter reconstructions of the brains of two Tasmanian devils (Sarcophilus harrisii) (Devils 1 and 2). They were able to reconstruct the cortical projection zones of the basal ganglia and major thalamic nuclei In the thylacines. Basal ganglia reconstruction (Bern and Ashwell, 2017) showed a more modularized pattern in the cortex of the thylacine, while the devil cortex was dominated by the putamen. Similarly, the thalamic projections had a more orderly topography in the thylacine than the devil. The results presented by Bern and Ashwell (2017) support the theories of brain evolution that suggest larger brains are more modularized. Functionally, the thylacine’s brain may have had relatively more cortex devoted to planning and decision-making, which would be consistent with a predatory ecological niche versus the scavenging niche of the devil.
Cortical maps of basal ganglia projections in all four specimens (two thylacine and two tasmanian devil specimens). Cortical zones were determined by Bern and Ashwell (2017) at each location: dorsal caudate (cyan), mid caudate (turquoise), ventral caudate (blue), putamen (purple). Modified from Bern and Ashwell (2017)
Citation: Berns GS, Ashwell KWS (2017) Reconstruction of the cortical maps of the Tasmanian tiger and comparison to the Tasmanian devil. PLoS ONE 12(1): e0168993. https://doi.org/10.1371/journal.pone.0168993
